Hcode
Microsoft AI

Copilot for Microsoft 365

2 - 4 Hours 4 Modules

Overview

Main Topic: Microsoft AI / Copilot

Course Duration: 2 - 4 Hours

Level: Beginner

Target Audience: Executives, Analysts, Project Managers and administrative teams

ABOUT THE TRAINING

This training is the definitive step to eliminate manual and repetitive tasks in the daily office routine. Unlike an isolated chat, Copilot for Microsoft 365 works directly within the applications your team already uses, functioning as a productivity engine that transforms drafts into professional documents, raw data into strategic analyses, and hours of meetings into immediate action plans.

Objective

Empower the employee to master Copilot as an intelligent assistant, ensuring a return on the license through standardization of quality and acceleration of bureaucratic and analytical processes.

TRAINING MODULES

Module 01

Fundamentals and Custom Instructions

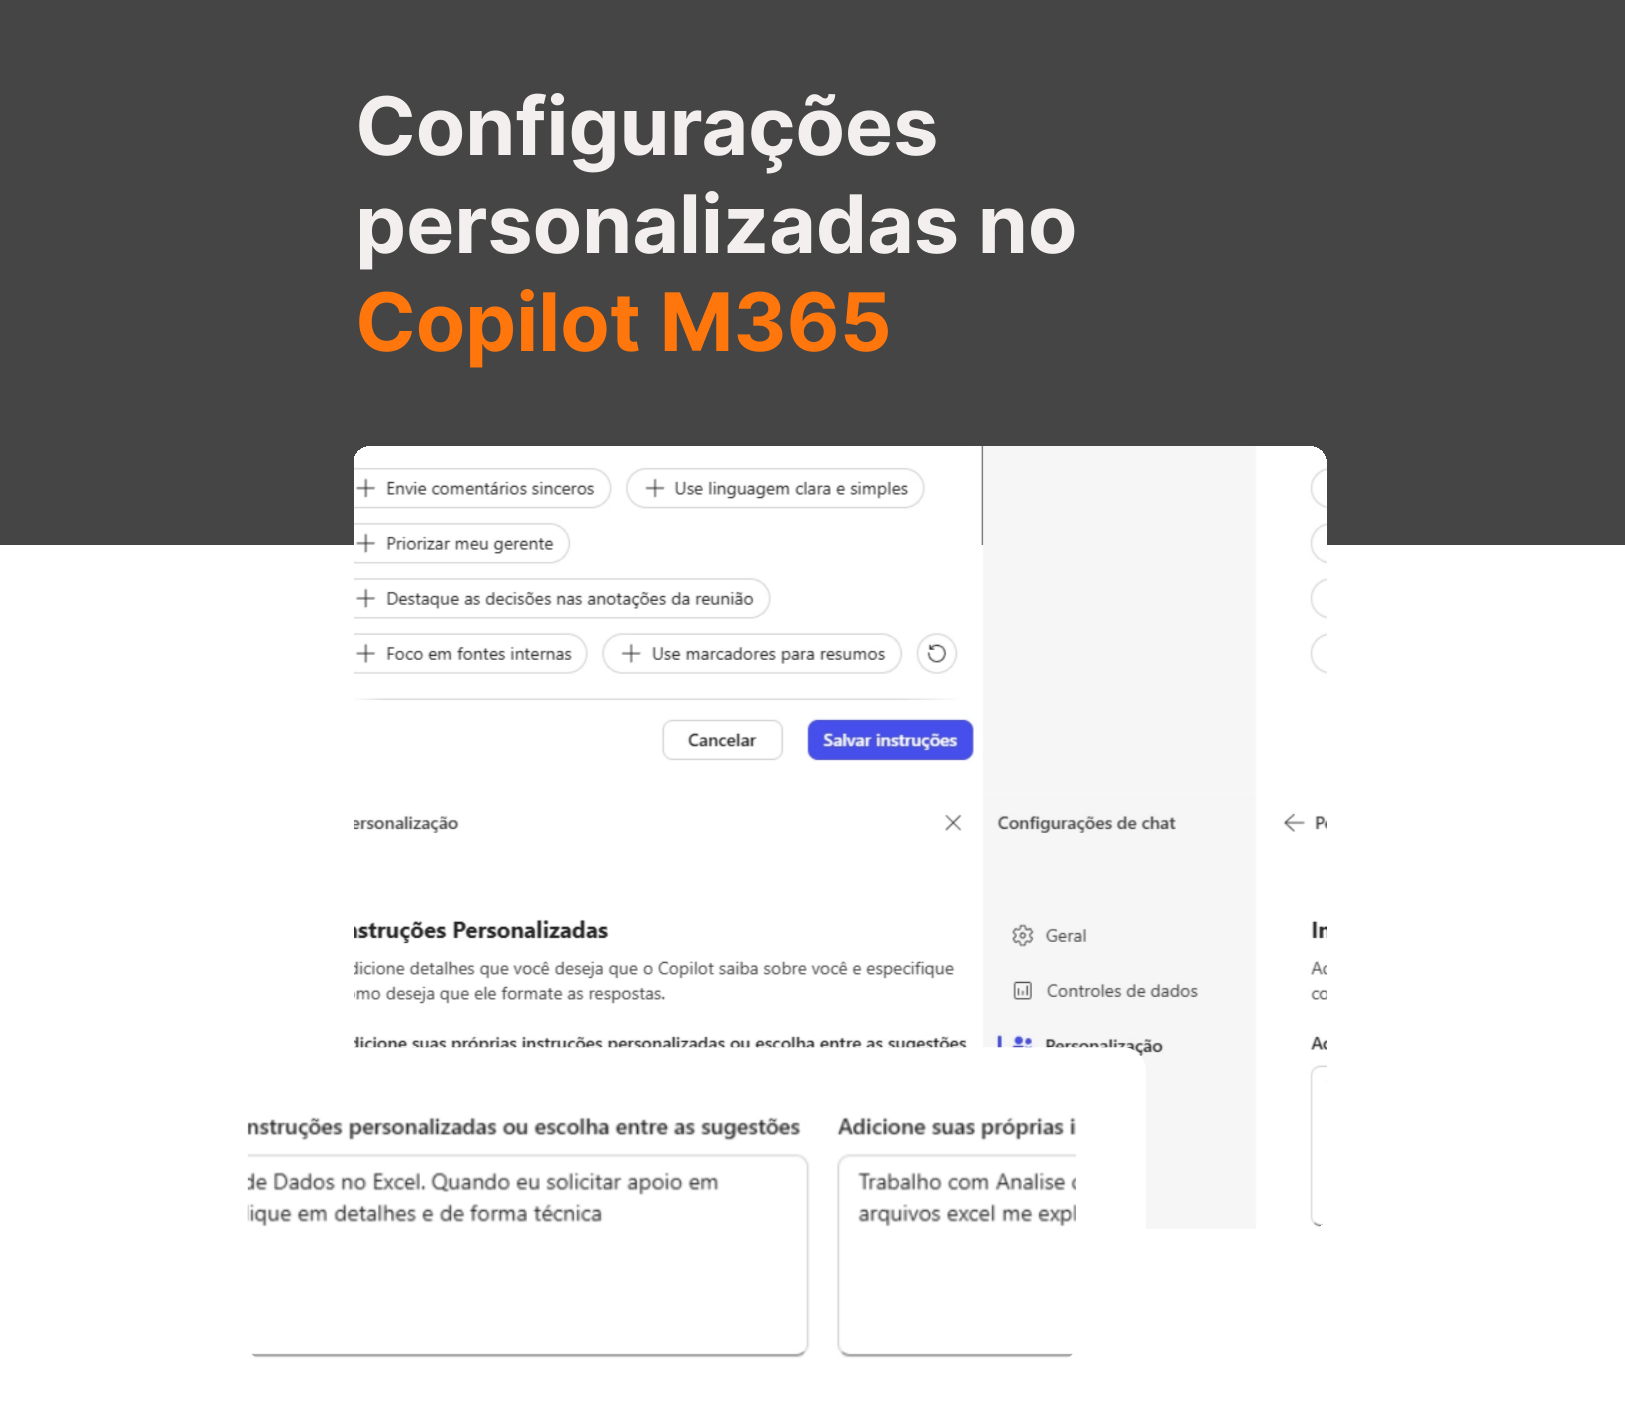
Preparing the environment for superior results. Learning about essential settings and creating "Custom Instructions" that define the user's persona and context, ensuring that the AI understands the nuances of your work before generating any content.

Module 02

Copilot in Excel: From Data to Decision

Transforming any employee into a data analyst. The student will learn to create complex formulas through natural language, generate pivot tables step by step, and request explanations about the logic behind financial or operational calculations.

Module 03

Word and PowerPoint: Assisted Narratives and Design

Focus on creating and refining content. Techniques for rewriting long texts into visual bullet points, suggesting images from professional banks that match the context, and transforming text documents into impactful PowerPoint presentations in just a few minutes.

Module 04

Intelligent Communication in Outlook and Teams

Managing information overload. Using AI to draft professional emails, summarize lengthy conversation threads, and extract key points and action items from meetings in Teams, allowing the team to focus on execution rather than manual synthesis.

Additional materials

Copilot and Word

COPILOT + WORD

Request sent to Copilot in Word

GENERATED RESULT

1. Spelling and grammar

The text is generally well written and correctly spelled. There are no obvious spelling errors. The technical terms and expressions fit the industrial context.

Points to watch:

  • The use of parentheses and slashes () in titles and tables could be replaced by cleaner formatting, such as dashes or plain commas.
  • In "O Lado Positivo". Even with the line break…, there is an extra space before the colon, and the term "O Lado Positivo" could be standardized as "Lado positivo".
  • "Gap de Produção" could be rendered as "lacuna de produção" to avoid anglicisms, unless the audience prefers the English term.

2. Tips to improve the writing

  • a) Clarity and directness
    Prefer shorter, more direct sentences, especially in technical reports.
    Avoid repetition, such as "produção realizada" and "produção real", unless there is a clear conceptual difference.
  • b) Standardizing terms
    Standardize technical terms and dates. For example: "Janeiro/26" could be "Janeiro/2026".
    Always use the same number format: "36.100 un." could be "36.100 unidades".
  • c) Structure and formatting
    Consider turning tables into clearer lists or boxes, which makes them easier to read.
    Highlight the main topics in bold or as subheadings, such as "Incidente Técnico", "Diagnóstico e Solução", "Novo Modelo de Manutenção".
  • d) Cohesion and coherence
    Spell out acronyms on first mention, such as "IPH (Índice de produtividade horária)".
    When presenting problems and solutions, connect the ideas: "The problem was X. To solve it, we adopted Y."
  • e) Suggested rewrite of a passage
    Original:
    "O atraso ocorreu especificamente na transição da Semana 2 para a Semana 3. O Evento: Nos dias 14 e 15, a Rotativa 01 sofreu uma ruptura na correia de tração. Consequência: Atraso na entrega de 6.600 revistas."
    Suggestion:
    "O atraso concentrou-se na transição entre a Semana 2 e a Semana 3. Nos dias 14 e 15, a Rotativa 01 apresentou ruptura na correia de tração, resultando em um atraso de 6.600 revistas na entrega."

Copilot and Excel

COPILOT + EXCEL

Request sent to Copilot in Excel

GENERATED RESULT

How to create a PivotTable in Excel (step by step)

  1. Prepare your data
    • Every column needs a header (e.g. Date, Product, Value).
    • There must be no completely empty rows or columns in the middle of the data.
    • The table has to be contiguous.
  2. Select the data
    • Click any cell inside the table
    • Or select the whole range manually
  3. Insert the PivotTable
    • Go to the Insert menu.
    • Click PivotTable.
    • Excel automatically selects your data range.
    • Choose where to put the PivotTable:
      • New worksheet (recommended)
      • Existing worksheet
    • Click OK.
  4. Use the PivotTable fields
    • A panel appears with four areas:
      • Filters
      • Columns
      • Rows
      • Values
    • How to use them:
    • Drag a field to Rows → the main category (e.g. Product)
    • Drag a field to Values → the calculation (e.g. Sum of Value)
    • Drag a field to Columns → side-by-side comparison (optional)
    • Drag a field to Filters → filter the whole table (optional)

Get in touch with our specialists

The names GPT-5 (OpenAI), Claude (Anthropic), and Gemini (Google) are mentioned solely for informational and comparative purposes.